Amazon Seller Profitability & Analytics Dashboard
Quantifiable Outcomes
The Story
Amazon sellers have to reconcile revenue across a fragmented set of financial events. The amount received from a sale is not equivalent to the actual profit generated by the product: marketplace fees, transaction charges, shipping costs, advertising and service fees, refunds, taxes, and settlement adjustments all affect the final outcome.
I built the Amazon Seller Profitability & Analytics Dashboard to turn that fragmented data into a single operational view of the business.
The goal was not simply to display sales figures. The system connects orders and settlements and breaks the financial outcome of a sale down into its underlying components, allowing sellers to understand whether individual products and the business as a whole are actually profitable.
The project started as a personal project and is now used by 10 recurring monthly customers. Although it is not commercially marketed, the users have been able to use the resulting analysis to make pricing and product decisions and identify actionable opportunities for improving their businesses.
The Problem
A seller looking at gross sales can easily overestimate profitability.
An individual order can generate revenue while simultaneously accumulating multiple marketplace charges. Amazon also provides settlements separately for B2B and B2C activity, making it difficult to trace a settlement back to the orders and financial events that produced it.
This creates several practical problems:
- Determining the actual profit of a product requires accounting for multiple fee categories.
- Settlement reports do not provide a straightforward order-to-settlement view.
- Refunds and other order lifecycle events affect the final financial outcome.
- Sellers need to understand how pricing changes affect actual profitability rather than just gross sales.
- Tax and GST reporting becomes harder when the underlying financial numbers have not been reconciled correctly.
- Large seller datasets make ad-hoc spreadsheet-based analysis increasingly difficult.
There was also a significant security consideration: the platform handles highly sensitive commercial and financial data. Seller order histories, settlement information, revenue, costs, and tax-related information should not be treated like ordinary application data.
This directly influenced the deployment and security architecture.
Architecture & Design
The application is built around a Python/FastAPI backend with SQLAlchemy providing the persistence layer. SQLite is used for the current deployment because the system is self-hosted on low-end bare-metal hardware as a personal project.
The application architecture separates application, authorization, and data-access concerns so that the deployment can evolve independently of the current SQLite-based setup. The application is also designed with horizontal scalability in mind, avoiding a design where one user’s workload inherently affects another user’s request processing.
flowchart LR
    A[Amazon Seller Data] --> B[Data Ingestion & Processing]
    B --> C[(Encrypted Data Store)]
    C --> D[FastAPI]
    D --> E[Authorization / RBAC]
    E --> F[Dashboard]

    F --> G[Business Overview]
    F --> H[Order Lifecycle]
    F --> I[Settlement Reconciliation]
    F --> J[Product Profitability]
    F --> K[Sales & Tax Analytics]
Security & Tenant Isolation
Because the application handles highly sensitive seller and financial data, I deliberately chose to self-host the system rather than place the data in a third-party hosted environment.
Self-hosting gives me direct control over the infrastructure, storage, network exposure, access model, and operational security of the deployment.
Security was treated as an architectural requirement rather than something added at the API endpoint level.
Strict RBAC
The application implements strictly enforced role-based access control.
Authorization is enforced server-side, meaning permissions are not dependent on the frontend hiding or disabling functionality. Requests are evaluated against the authenticated user’s permissions before protected operations are performed.
This provides a consistent authorization boundary across the application rather than relying on individual UI components to enforce access.
Architectural Tenant Isolation
Tenant isolation was designed to prevent cross-tenant data access at the architectural level.
A user’s tenant context is carried through the application and data-access layers so that queries operate within the authorized tenant boundary. The design does not depend on users manually supplying or manipulating tenant identifiers to select which records they can access.
This is particularly important for a multi-tenant analytics application: a malformed request or an incorrect identifier should not be sufficient to turn a legitimate query into a cross-tenant data query.
The objective is to make cross-tenant querying structurally unavailable through normal application paths rather than relying solely on developer discipline.
Encrypted Data
Sensitive application data is stored in encrypted form.
This provides an additional layer of protection for seller information in the event that the underlying storage is accessed outside the intended application flow.
Combined with self-hosting, strict RBAC, and tenant isolation, encryption forms part of a defense-in-depth approach to protecting the financial and commercial information handled by the platform.
Performance
The system was designed to keep analytical queries responsive even with relatively large seller datasets.
For a seller sheet containing approximately 60,000 rows, the major queries complete in under 200ms including network latency on the low-end hardware hosting the application.
Achieving this required treating query design and data access as first-class parts of the application rather than relying on the dashboard layer to perform expensive calculations repeatedly.
The result is a system capable of providing interactive analytics without requiring dedicated cloud infrastructure.
Product & Financial Analytics
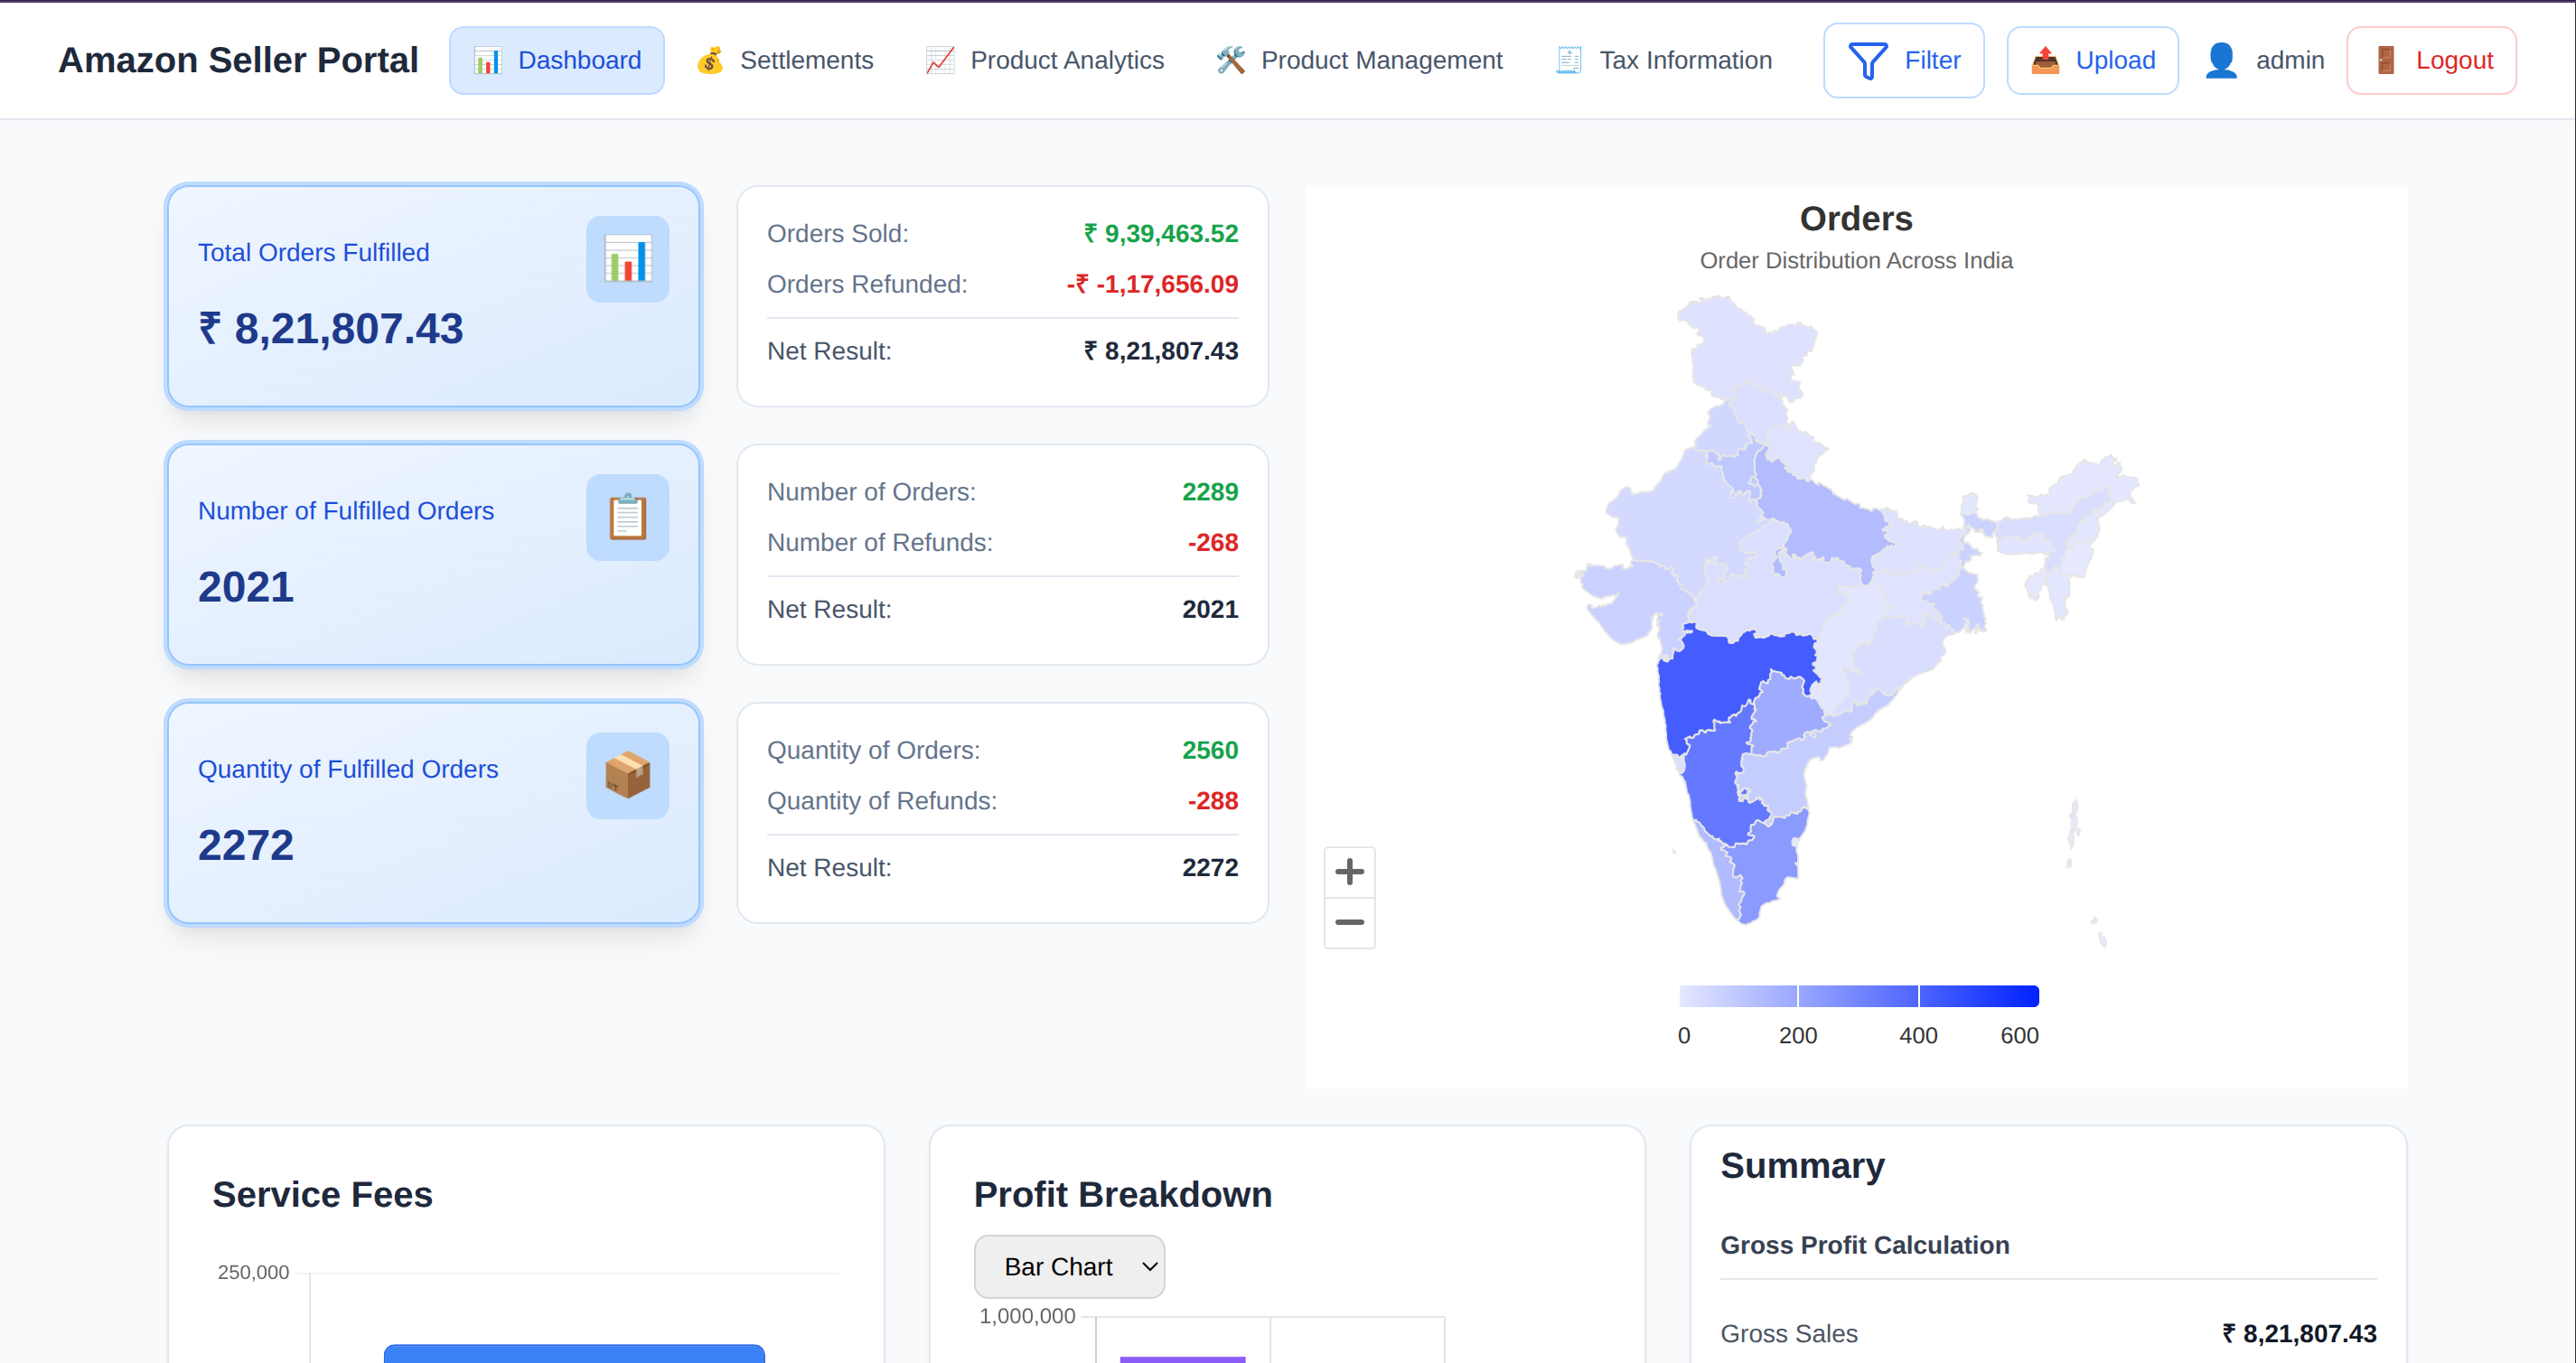
The main dashboard provides an overview of the seller’s business performance, including:
- Orders placed and refunded
- Items ordered and refunded
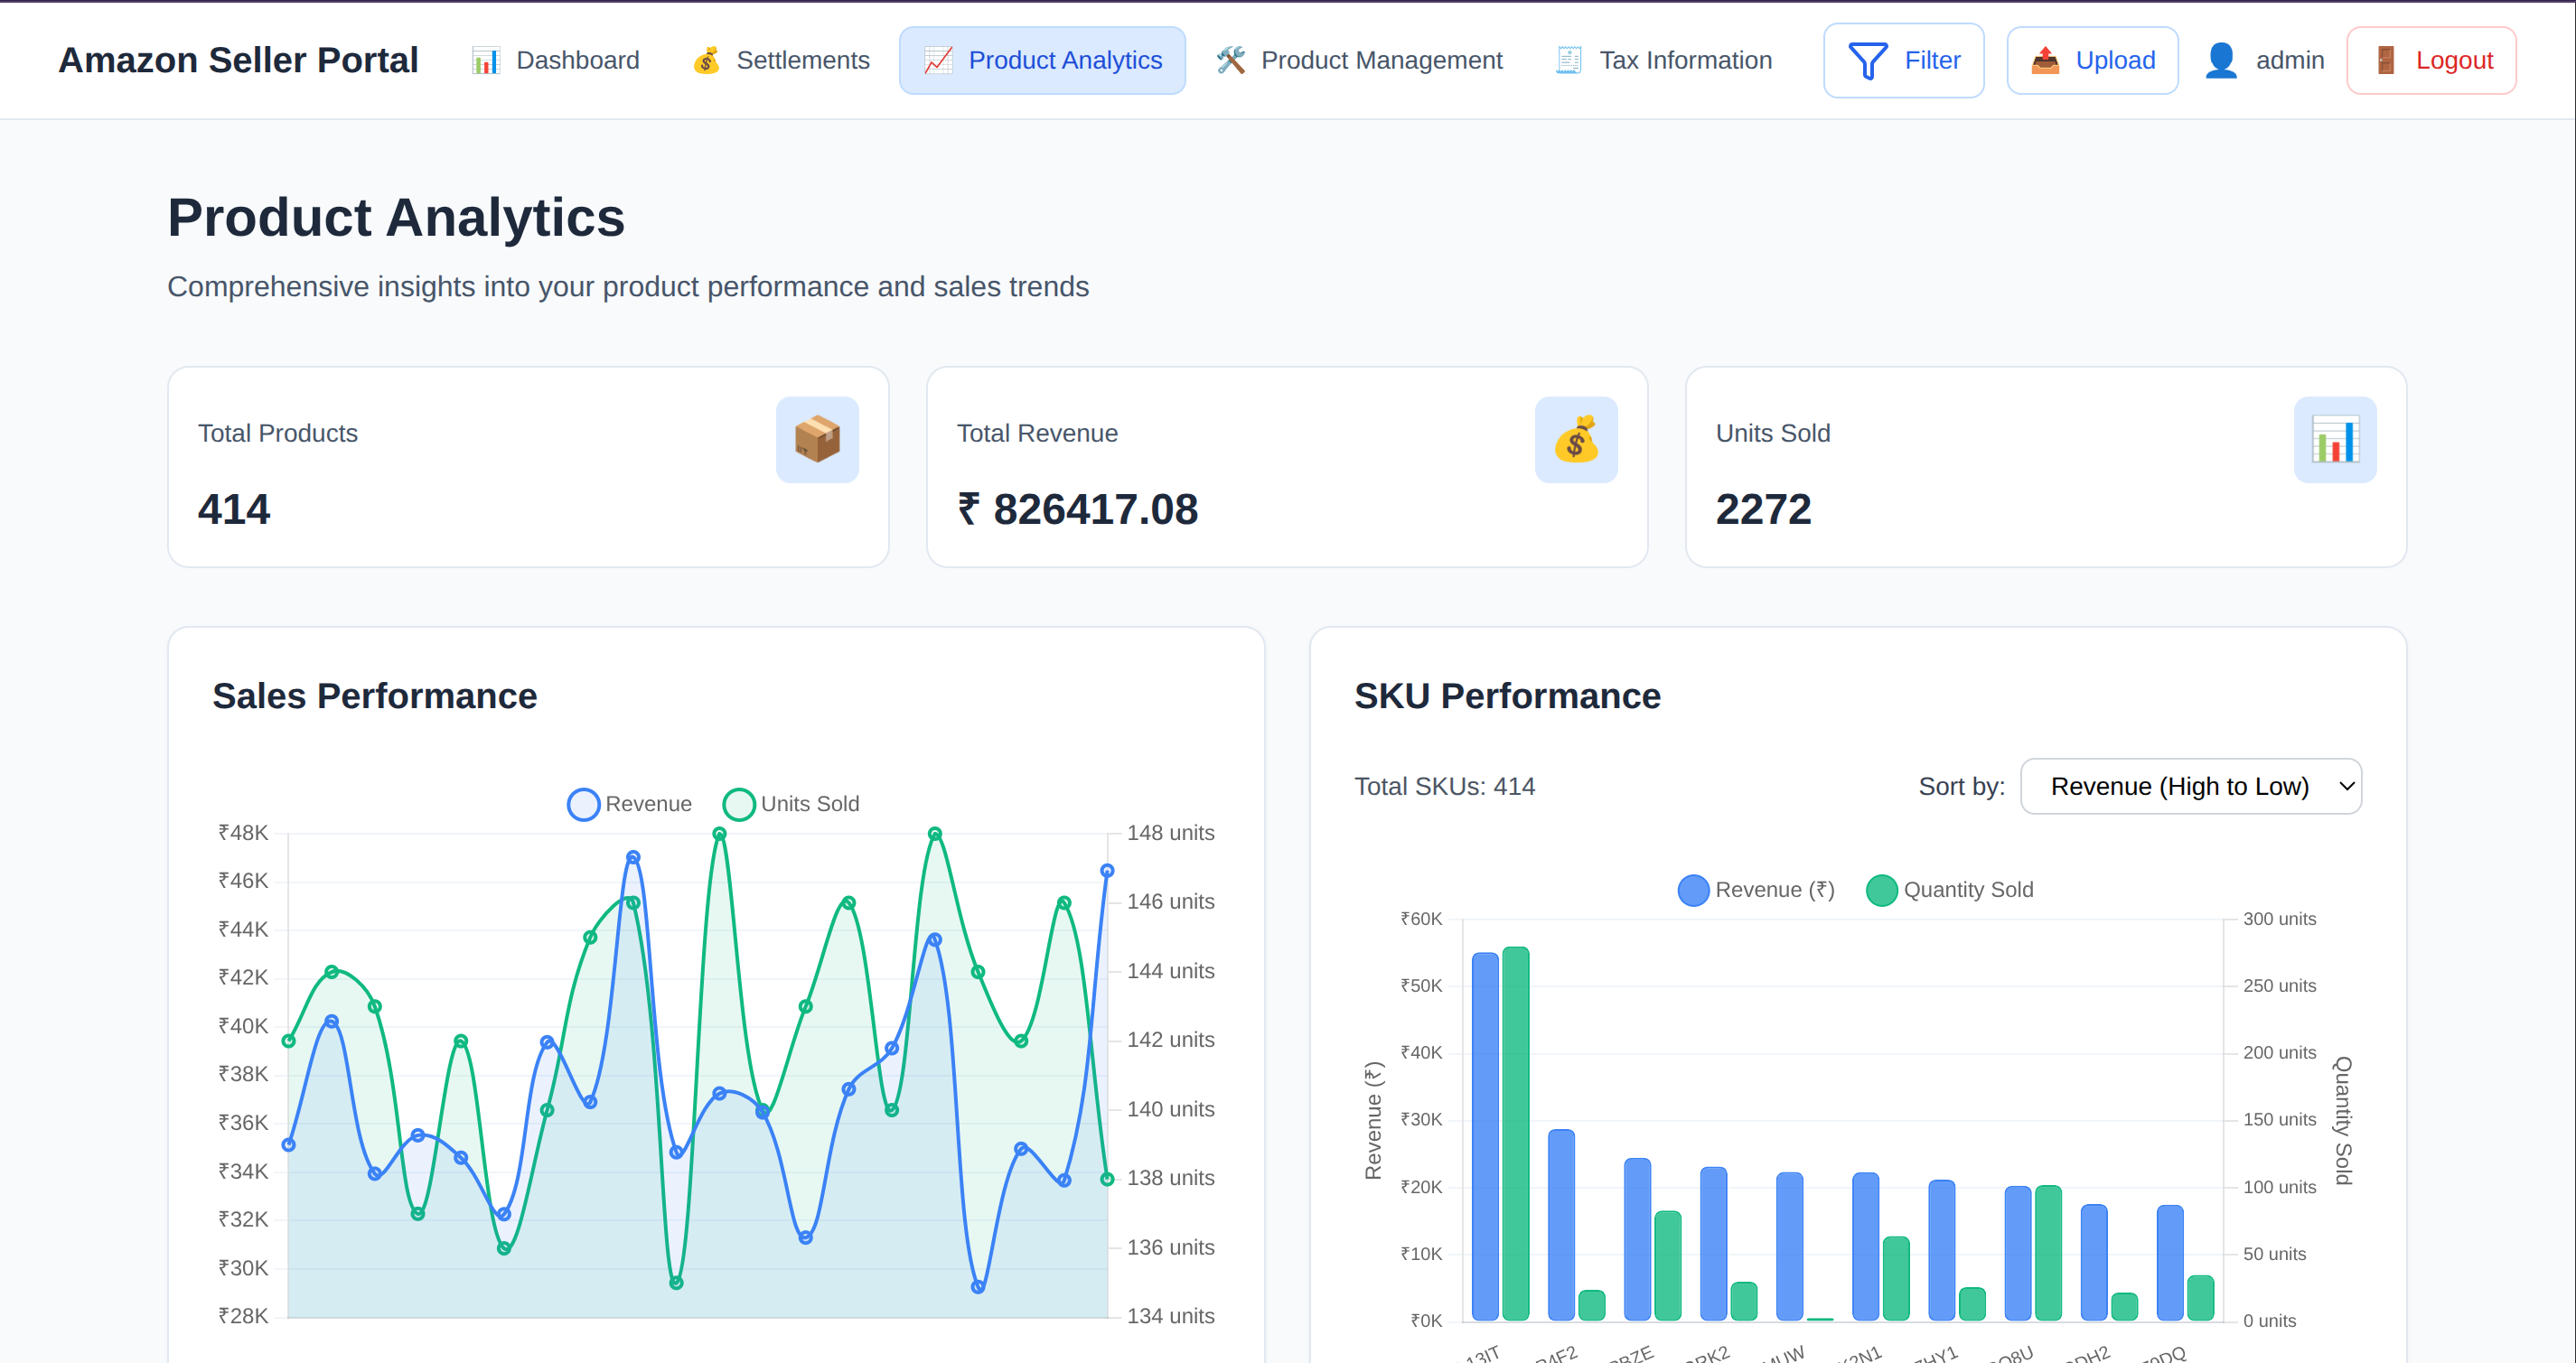
- Sales trends
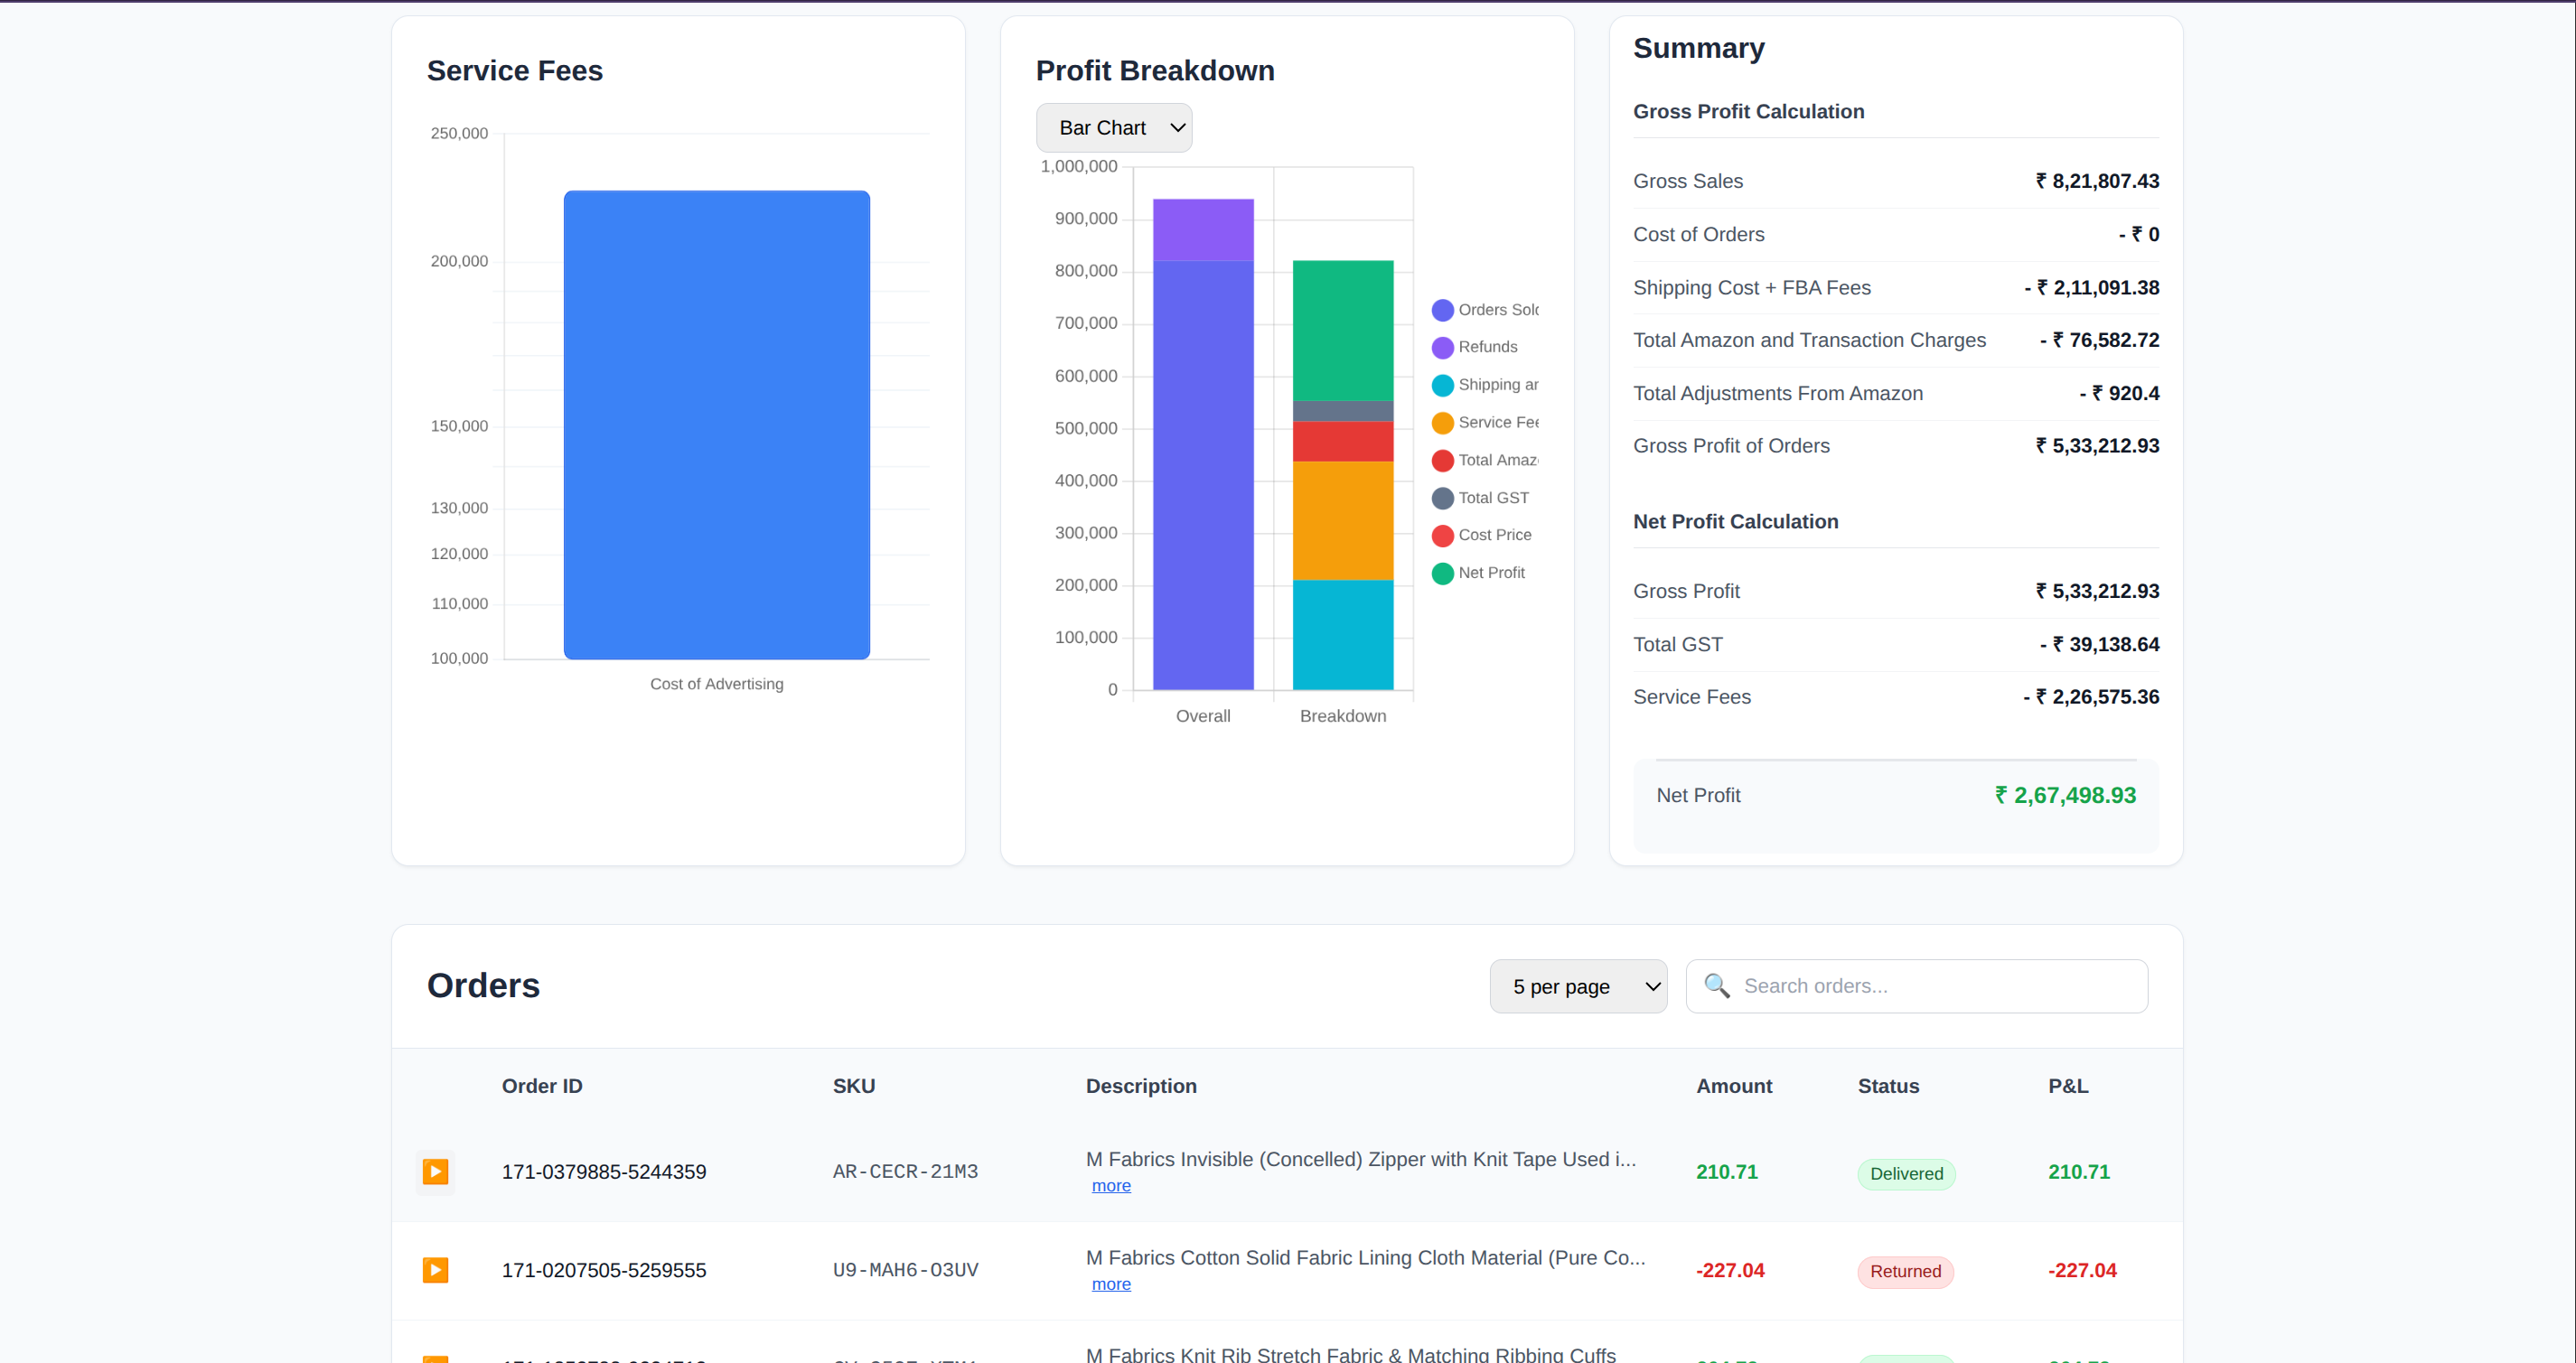
- Profit and loss
- State-wise shipping distribution
- Breakdown of marketplace and service charges
- Tax and GST summaries
- Settlement information
Financial charges are presented as components of the final outcome rather than being hidden behind a single aggregate number. A stacked breakdown makes it possible to see how different charges contribute to the difference between gross sales and actual profit or loss.
Product-Level Profitability
A central part of the system is the ability to evaluate profitability at the product level.
Instead of asking only how much a product sold, the dashboard exposes the components that determine its actual financial outcome. This allows sellers to experiment with different pricing strategies, add or remove products, and compare the resulting sales and profitability data.
This turns historical sales data into a tool for making product and pricing decisions.
Order Lifecycle & Settlement Reconciliation
The per-order view provides a detailed lifecycle for an individual order and connects it to its financial outcome.
A seller can inspect:
- The lifecycle of the order
- Whether and when the order was refunded
- The settlement in which the order was paid out
- Charges associated with the order
- The resulting financial breakdown
The settlement relationship is particularly useful because Amazon’s B2B and B2C settlements are distributed separately. Connecting those settlement records back to individual orders makes it possible to move from an aggregate payout to the underlying transactions.
Impact & Metrics
The dashboard is a personal project rather than a marketed commercial product, but it has developed a recurring user base of 10 monthly customers.
Users have used the analysis to:
- Update product pricing based on actual profitability.
- Add or remove products based on their financial performance.
- Test different pricing strategies.
- Validate sales and settlement data.
- Identify actionable opportunities for improving business performance.
- Produce clearer tax-related figures from reconciled financial data.
The system also processes high-volume monthly sales data while maintaining interactive query performance on modest self-hosted hardware.
Engineering Tradeoffs
SQLite and Bare-Metal Deployment
The project intentionally uses SQLite and low-end hardware rather than cloud infrastructure. This keeps the operating cost and operational complexity low for a personal project.
The decision to self-host was also driven by the sensitivity of the data. The platform contains commercially sensitive information about seller revenue, orders, settlements, costs, and tax-related figures, making infrastructure ownership and control an important security consideration.
The tradeoff is that the current persistence layer is not intended to provide the distributed write characteristics of a production database cluster. The application architecture therefore keeps the persistence layer sufficiently separated that the storage technology can be evolved if deployment requirements grow.
Security vs. Convenience
Security controls were designed to exist below the presentation layer.
Rather than relying on frontend behavior to determine what a user can access, authorization and tenant boundaries are enforced by the backend and data-access architecture. This increases implementation complexity but reduces the risk that a client-side change or manipulated request can bypass the intended access model.
Analytical Depth vs. Simplicity
The dashboard could have exposed raw Amazon reports directly, but that would have pushed the reconciliation problem onto the user.
Instead, the system focuses on derived business concepts such as actual profitability, settlement relationships, charge breakdowns, and product-level outcomes. This requires more processing and data modeling but produces substantially more useful information for decision-making.
Performance vs. Infrastructure
Rather than solving analytical workloads by provisioning larger servers, the system was optimized to operate effectively on constrained hardware.
This constraint influenced the way queries and data access were designed and provided a useful validation that the application’s performance did not depend on expensive infrastructure.
Lessons Learned
The project reinforced that financial analytics systems are fundamentally reconciliation systems rather than simple reporting dashboards.
Displaying revenue is relatively straightforward. Establishing how that revenue maps to orders, refunds, fees, settlements, taxes, and ultimately profitability is where most of the engineering complexity lies.
It also demonstrated that security boundaries need to be designed alongside the data model. For a multi-tenant system containing sensitive financial information, RBAC and tenant isolation cannot be treated as frontend features. They need to be enforced by the backend and reflected in the way data is accessed.
The project also showed the value of efficient data access early in the design. With tens of thousands of rows and constrained hardware, query performance directly determines whether an analytical interface feels interactive or becomes another reporting workflow users have to wait for.
Most importantly, the project showed that a relatively small system can provide significant business value when it models the underlying financial workflow correctly. The recurring users and the pricing and product decisions they have made from the resulting analysis provide practical validation of that approach.